Explain it to a Golden Retriever – A Review of World ETFs


The Definitive Guide to Equity Index Investing - PART 2
This article is Part 2 of our definitive guide to Equity Index Investing.
In 2019, I cycled 4,000+ km across Japan, from Hokkaido to Okinawa. A few typhoons forced me to leave, but one reason I will come back is architecture, especially the peaceful countryside and the Japanese gardens.
Japanese people love minimalism and simplicity. In a lot of fields, as Steve Jobs said, building Simple products is Hard. Making a product like the iPhone certainly was.
Yet, in investing, building Efficient portfolios is simple.
KEY TAKEAWAYS
- If you can’t explain it to a Golden Retriever, you don’t understand it.
- Your complicated strategy will ultimately be tested by the market, like the 2008 value of Subprime Bonds was for German investors. That’s when most investors bail out.
- If you asked an experienced Wall Street Professional to Hold On a Fund for Dear Life, she would likely choose a Global ETF.
- Global ETFs cover all sectors and countries, follow the money, are cheap, hassle-free and unbiased.
- For long term investors, the best UCITS and non-UCITS ETFs are from the ‘big 3’. UK Investors have a couple of additional Mutual Funds to choose from.
Here is the full analysis
What if you could only buy ONE single investment
I spent part of my career managing Asset Backed Securities. Yes, the ones that blew up in 2008. I actually went into this field only in 2009 – to ‘clean up’ the mess.
One thing that you quickly learn when running complex, multi-layered models, is to be alarmed when investments get complicated, and if you can’t explain it to a six-year-old, or a Golden Retriever.
Be alarmed if you can't explain it to a Golden Retriever
One of the biggest mistakes Investors made was taking things at face value, especially for very complex products, while being remote from the place where these products originated.
I look at you, German Investors in US Subprime Bonds.
It happened, for example, when an Investor bought Assets with the highest credit rating but didn’t quite understand and didn’t have the systems to analyse.
Most of us don’t have access to sophisticated products, but a lot of traps remain. Academic research and empirical evidence point to the fact that simple Investing Strategies like Index Investing usually work best, are easily understood and accessible to anyone.
What if you could only buy into ONE single investment and HODL?
Interestingly, when you speak to people that have been in the investment business for a long time and ask them the above question, which by definition makes them think about their true beliefs and long term risks they understand and leaves short term speculation off the table, with the idea that:
- They could only choose one passive investment for their personal portfolio
- HODL (Hold On for Dear Life) so that they can only withdraw from it to fund their living expenses.
The answer often is... a World Equity ETF
Sure enough, if we assume you can’t swap investments and can only withdraw to fund your living expenses, we’re taking out the biggest investment risk out of the equation – yourself and your emotions.
And in fact, wise investors often move from complex portfolios to this simple strategy as they realize that the market almost always wins in the long run.
❤️🐶 Shop & Support - Celebrate our 4th anniversary! 4️⃣🎂
Spread the Golden Retriever Wisdom Across Europe & the UK 😎
Banker On Wheels is 4 years old! To celebrate our anniversary we have launched the official merchandise store – Shop.Bankeronwheels.com. You can now get your favourite Golden Retriever, or your factor tilt on a coffee mug or a T-Shirt while supporting our cause! All profits are reinvested into creating more educational content. Alternatively, you can also buy us a coffee. Thank you for all your support ❤️

The Simplest Investment - A World ETF
Do you need knowledge to invest?
You don’t need much knowledge to put your cash to work.
In fact, to get exposure to World Equities, you only need a single ETF. And this exposure evolves with the markets as certain markets grow or decline.
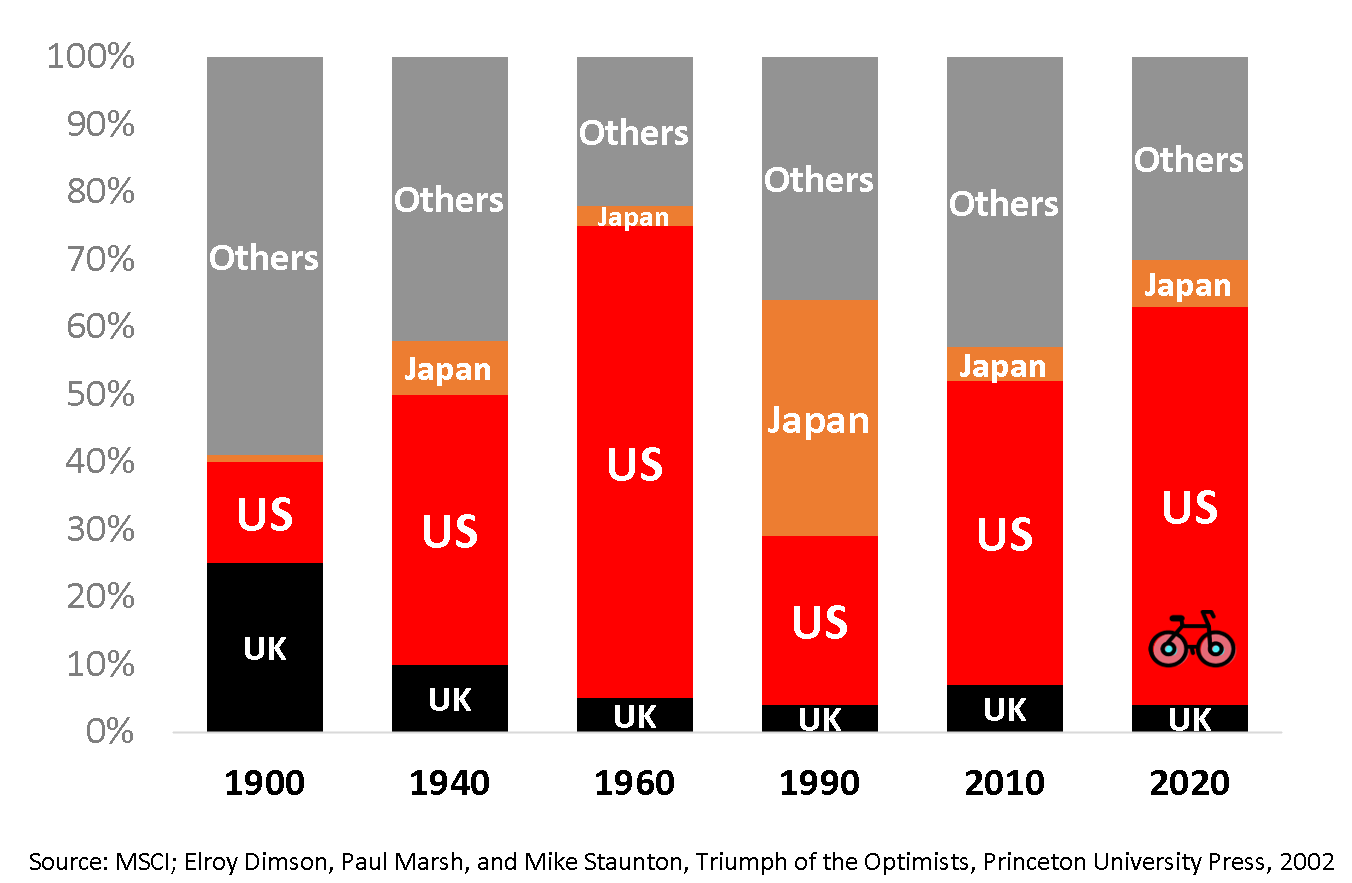
Current country weights in the World Equity Index
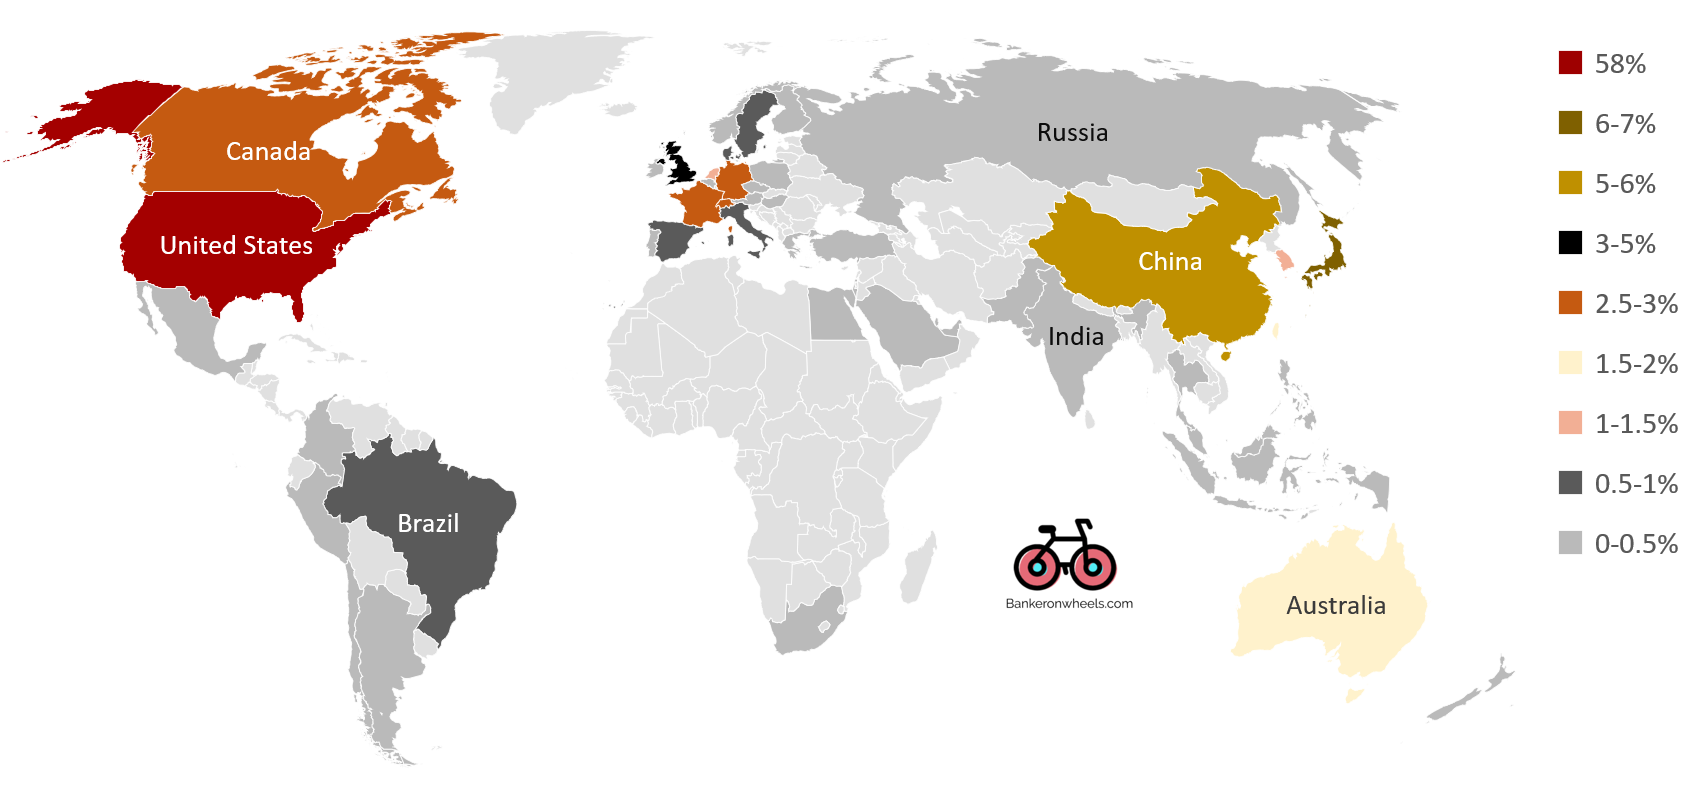
Currently, c. 60% of all World Stocks as measured by market capitalization are US Equities, but it wasn’t always that way.
It may not always remain so. While there are reasons for the current allocations, imagine if China or India accelerated opening up and transparency of their Capital Markets? China’s current weight is only c. 4% in the Global Stock Market, whereas its GDP is 65% of the US GDP. The mix of Emerging Market sectors, with more Tech, is changing interesting as well. And US Tech often doesn’t have access to those markets.
Stock Market performance as measured by size
But how did the World ETFs perform? Let’s look at the Benchmark with the longest track record – the MSCI ACWI Index.
Advertisement

Advertisement

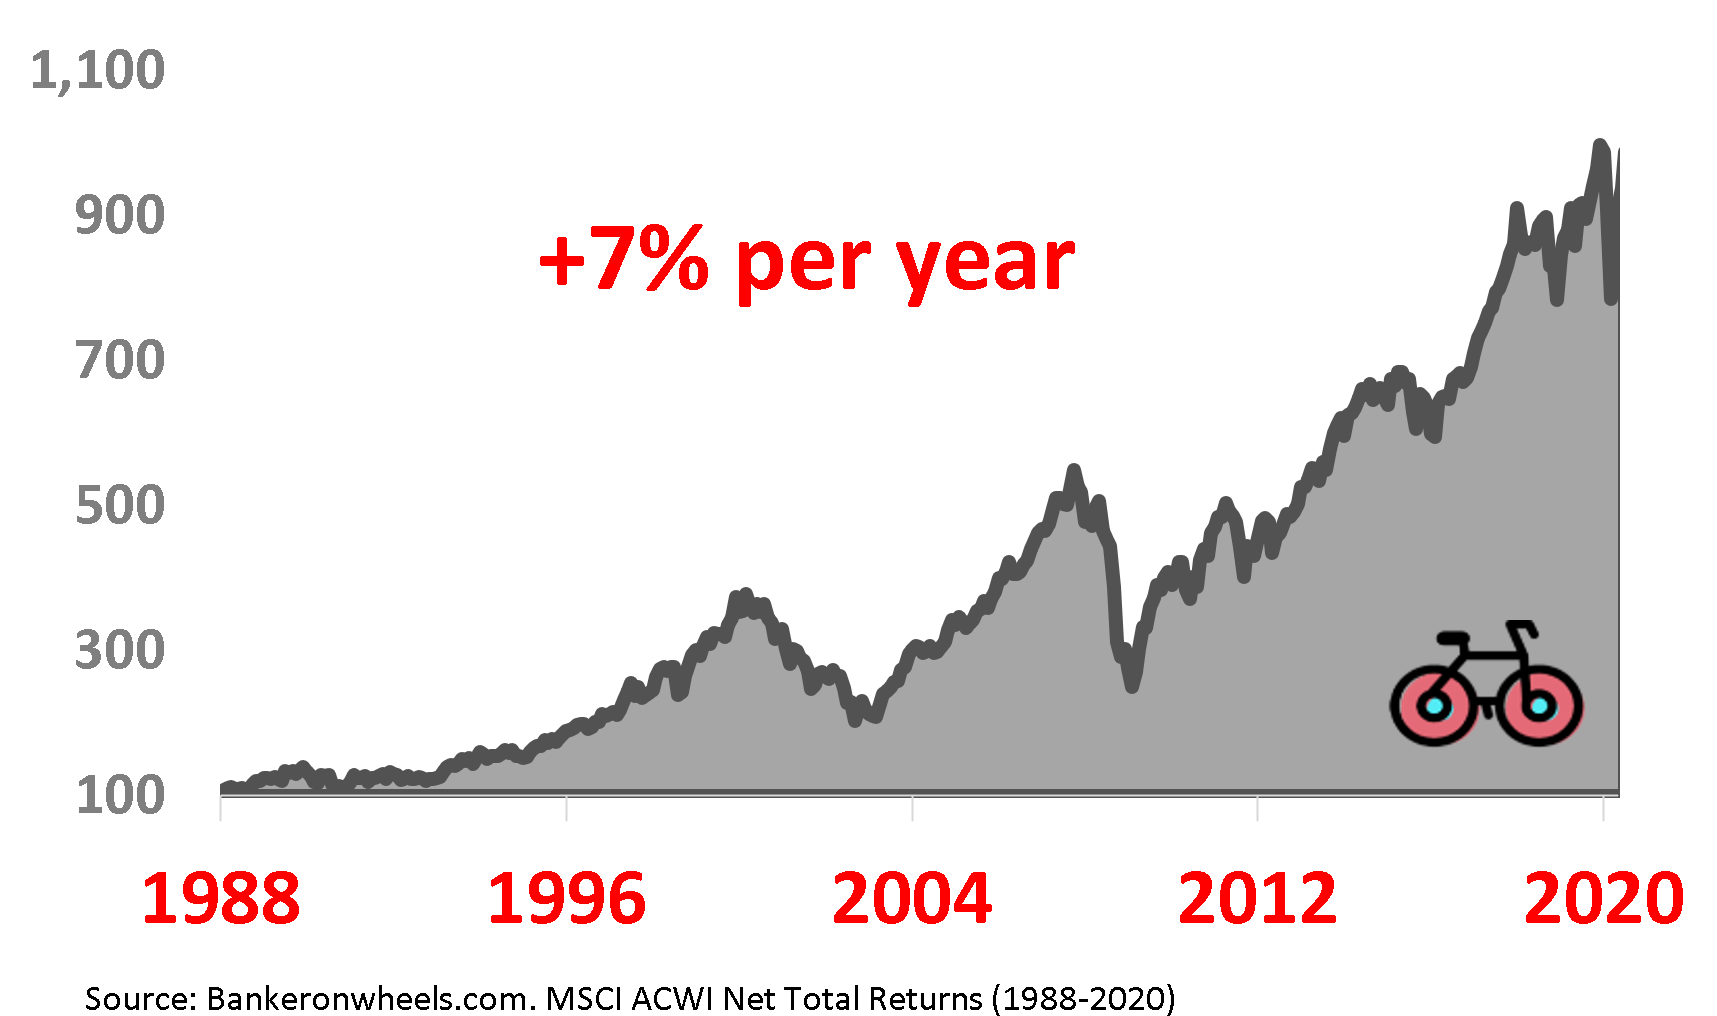
World ETF Benchmark Performance
Doubling in 10 Years, then going exponential
If you assume a 10-year investment horizon, by having invested $1,000 and kept it for the entire period it would have on average returned c. 7% per year (accounting for 0.3% fees but before 2-2.5% inflation) and your portfolio would have doubled, on average, during those first 10 years.
Of course, if you held longer than for a decade, the return would be closer to exponential over time given how compound interest works.
World ETF Benchmark Total Return (1988-2020)
The graph below shows the cummulative net profit at the time when you sold a 10-year World Equity ETF.
For instance, a portfolio worth $3,300 that is – the $1,000 initial investment and $2,300 profit, if sold in 2019 and invested 10 years earlier, in 2009.
Net profit from investing $1,000 over 10 years
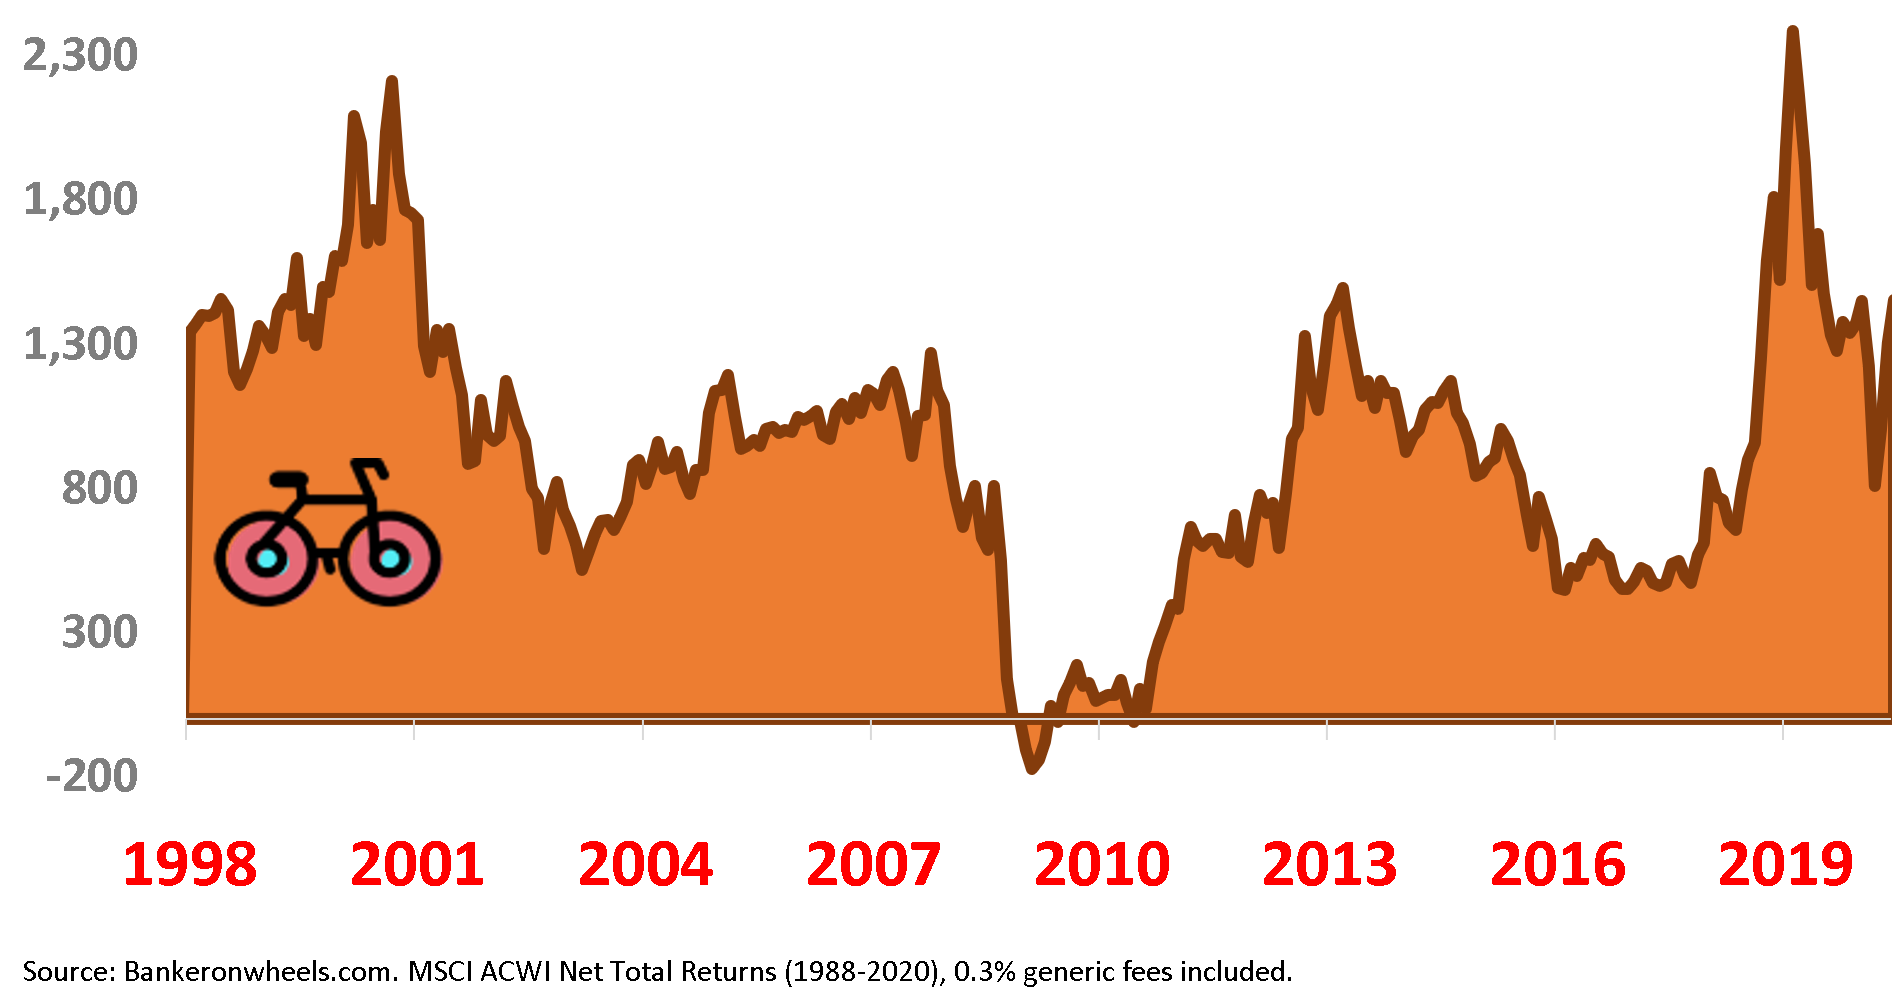
Losses were Virtually Impossible
More importantly, as wise investors know, the likelihood of having a negative yielding portfolio was close to zero beyond a 10-15 year holding period.
In fact, from 1988 to 2020 the likelihood was below 3% if you kept the portfolio for the entire 10-year holding period. Essentially the only case was if you invested in 1999 and was forced to sell in 2009.
Simple doesn't mean the ride will be easy
Maximum loss from last market peak on $1,000
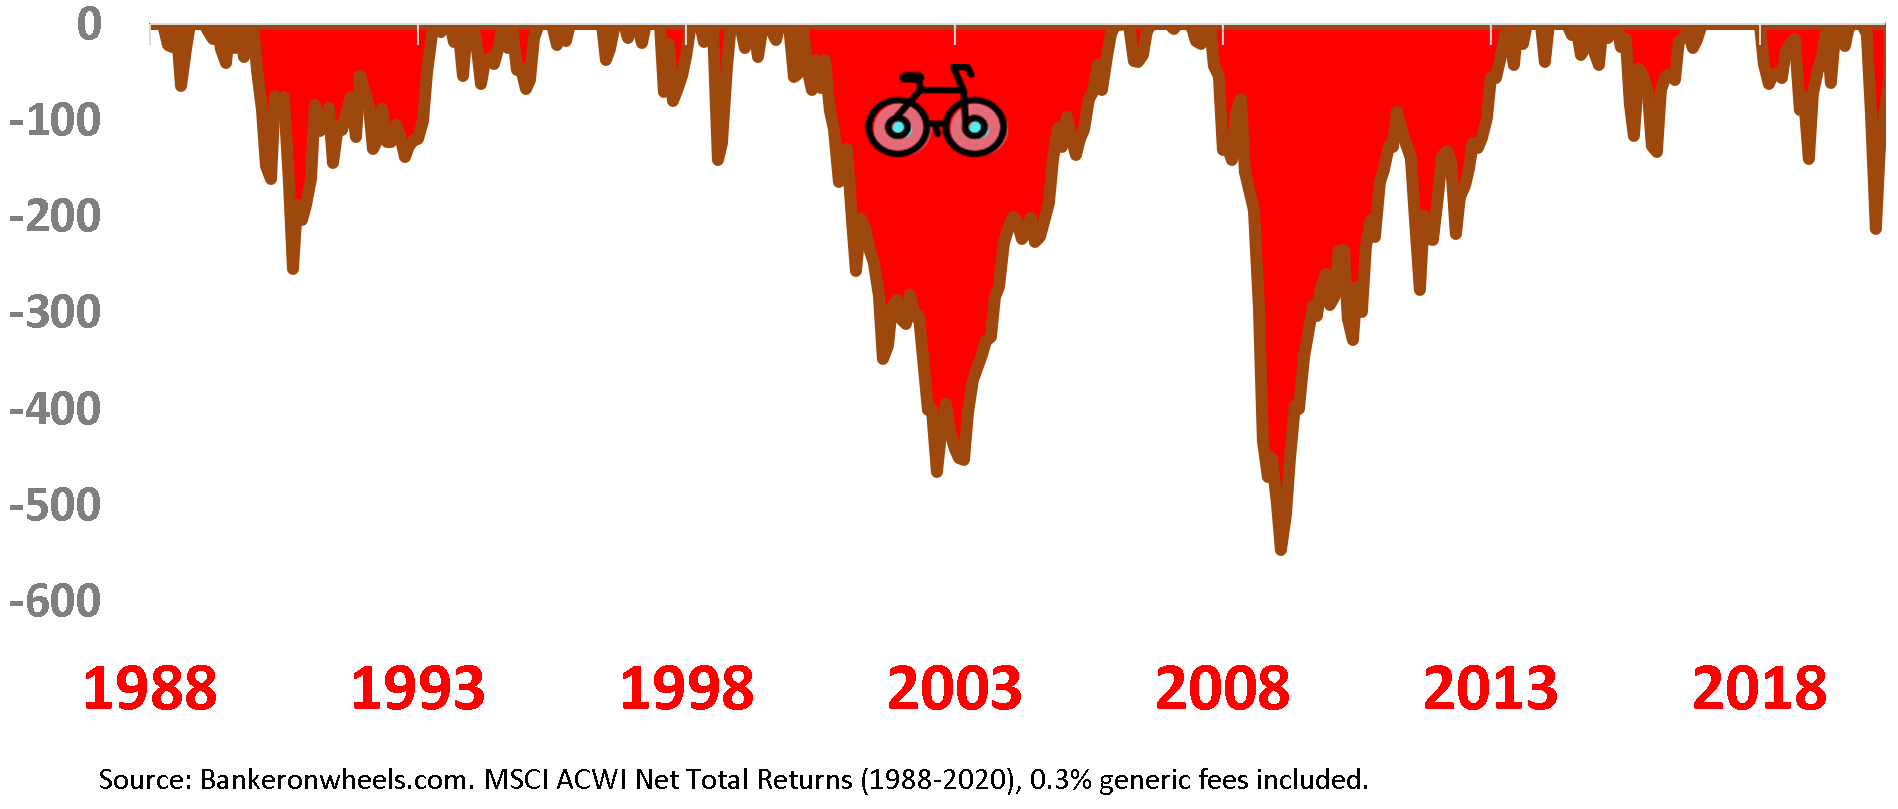
And yet, this is a hypothetical exercise and assumes the emotions are not part of the game.
If you watched your Investment Account at the end of every month, I don’t and managed to forget my broker account password recently, which I’m really proud of, there would have been cases where losses would be close to or even slightly exceeded 50%. This assumes that your reference point was the previous market peak.
It’s not how one should look like at a portfolio, but often investors do and that’s why portfolio protection is key.
Now, what are the practical arguments for such a radically simple Equity Portfolio?
5 Reasons Why You should consider a Global ETF
#1 - The World ETF covers all countries and sectors
- Your exposure is to All Developed Countries and Emerging Economies
- The only exception are Frontier markets (tiny markets with marginal influence)
- The other exception are usually Small Caps, because most ETFs follow either MSCI ACWI or FTSE All World (see here for my comprehensive comparison of Equity Indices)
#2 - The World ETF follows the Money
The benchmarks that these ETFs track are market capitalization Indices. It means that the larger a country, sector or company gets the bigger will be your exposure. You bet on the recent winners and follow how the best brains in Finance are allocating capital to the most productive companies, and this, worldwide.
#3 - The World ETF is unbiased
You wouldn’t be over-exposed to certain countries, e.g. your own because of your arbitrary preference. Or even companies you shouldn’t be. Again, you go with the flow.
#4 - The World ETF is hassle-free
If your portfolio has multiple ETFs you have more rebalancing work and potentially tax implications. You also have to rebalance your portfolio whenever it drifts from your desired allocation. You can focus on more interesting things in life than ETFs.
#5 - The World ETF is cheap
One ETF is cost-efficient and involves less transaction fees. There is no need to rebalance your Equity portfolio and incur trading costs.
Advertisement
As of 29/03/2024, Interactive Brokers offers rates up to 4.738% (GBP), 3.445% (EUR) and 4.83% (USD) on cash.
Advertisement
As of 29/03/2024, Interactive Brokers offers rates up to 4.738% (GBP), 3.445% (EUR) and 4.83% (USD) on cash.
5 Criteria that matter
What Should I Consider As A Long Term Investor?
- Only well-established names in the Industry
- Minimum Fund size of $200m
- Funds tracking ALL Developed & ALL Emerging Countries (if possible, also Small Caps)
- Preferrence for physical replication only (because a Golden retriever wouldn't understand synthetic replication)
- No currency hedging (in line with market practice)
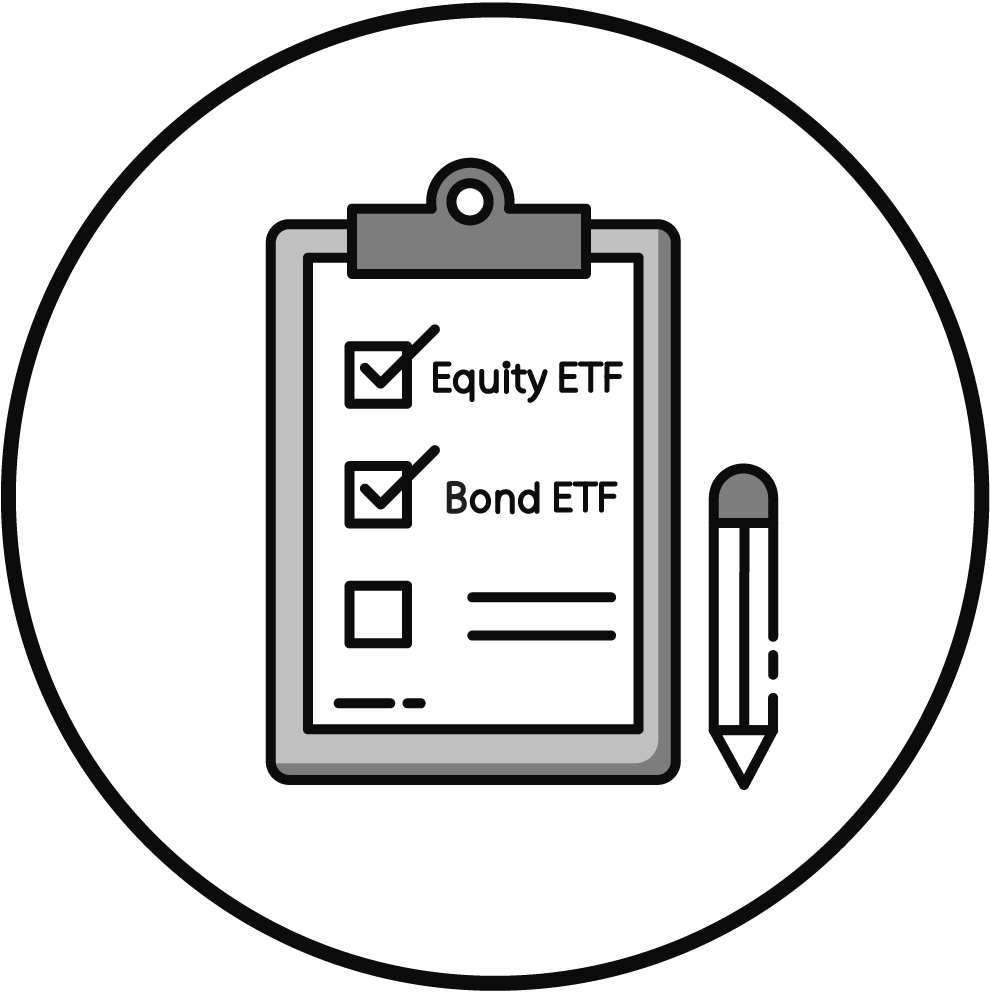
Comparison of Best World ETFs
While there are other alternatives, if we apply the above criteria of a long term investor, only 3 candidates really stand out:
- Vanguard’s FTSE All-World UCITS ETF
- BlackRock’s iShares MSCI ACWI UCITS ETF
- State Street’s SPDR MSCI ACWI IMI UCITS ETF
Key ETF Characteristics & PERFORMANCE METRICS
| Rank | Global(World) ETF | 3Y TD | TER | Acc. | Dist. | Replication | Size | Inception | Domicile | Benchmark | Acc ISIN | Dist ISIN | Rank Category |
|---|---|---|---|---|---|---|---|---|---|---|---|---|---|
| 1 | Vanguard FTSE ALL-World UCITS ETF | 0.0% | 0.22% | ✓ | ✓ | Physical | 13.9 | 05/2012 | Ireland | FTSE All World Net Total Return Index | IE00BK5BQT80 | IE00B3RBWM25 | Large & Mid Caps |
| 2 | iShares MSCI ACWI UCITS ETF | -0.1% | 0.20% | ✓ | ✘ | Physical | 6.3 | 10/2011 | Ireland | MSCI All Country World Net Total Return Index | IE00B6R52259 | ✘ | Large & Mid Caps |
| 3 | SPDR MSCI ACWI IMI ETF UCITS ETF | 0.1% | 0.17% | ✓ | ✘ | Physical | 0.5 | 05/2011 | Ireland | MSCI ACWI IMI Net Total Return Index | IE00B3YLTY66 | ✘ | With Small Caps |
What Benchmarks Do World ETFs Track?
BlackRock’s iShares tracks the MSCI All-Country World Index, Vanguard tracks its FTSE equivalent, the FTSE All-World Index and the SPDR ETF the MSCI ACWI IMI.
Do they differ?
- The FTSE All-World Index – tracks c. 90% of the Investable Universe.
- MSCI All-Country World (ACWI) Index – tracks about 85% of the Investable Universe. In practice, the difference between them is marginal, as both are very highly correlated.
- MSCI All Country World IMI (ACWI IMI) Index – aims to track 99% of the Investable Universe. It has the additional benefit of tracking Small Caps (hence the IMI that stands for Investable Market Indexes in its name).
How Do Asset Managers Achieve This Goal?
- In practice, Asset Managers like State Street use Optimised Sampling technique (or common risk factors) to replicate the performance of the Index because investing in over 9,000 Stocks is not easy and cost-efficient for small, illiquid stocks.
- For example, the SPDR ETF does that with only c. 1,800 Stocks. And based on the Tracking Difference, it does the job well.
- The iShares ETF holds about 2,300 Stocks, while Vanguard invests in almost 3,900 Stocks.
How Did I compare Their Performance?
- I have assessed the ETFs based on Tracking Differences. Understand why it’s key in ranking ETFs.
- Calculations were based on data from Bloomberg and TrackInsight, two very reputable sources.
- The comparison is made over a 3-year period, to avoid any short-term tracking errors.
What are the Tax Implications?
All ETFs are domiciled in Ireland. For most Europeans, Ireland may have the advantage of lower withholding taxes for US Assets that represent over half of the Index.
Should your tax situation require another jurisdiction, Lyxor does track the MSCI ACWI Index via a synthetic, Luxembourg-based ETF.
Our Verdict
Remember, the ranking is just a guidance based on the above criteria. However, investing is individual and you should assess your own requirements. The U.S. “BIG 3” Asset Managers all have strong reasons to invest with them. But until 2021, Vanguard stood out. However, with the recent drop in TER, BlackRock will be a serious challenger in the years ahead.
Vanguard FTSE All-World UCITS ETF
- The Boglehead’s favourite ranks consistently at the forefront in terms of Tracking Difference. In fact, over the past 36 months, it hardly incurred any net costs (0% TD compared to a Net Tax Index).
- Vanguard FTSE All-World ETF is also cheap using the forward-looking TER metric, with ongoing cost of 0.2%.
- Vanguard manages the largest fund in this category. It attracted most capital and across all share classes, manages c. $14 bn.
- Vanguard gives the flexibility of reinvesting and distributing dividends.
- Vanguard tracks the FTSE All-World Index, which covers a larger universe than the MSCI ACWI.
Best Alternatives
iShares MSCI ACWI UCITS ETF
- BlackRock has the strongest Brand Name among Institutional Investors and the biggest Asset Manager in the World in terms of Assets Under management.
- The iShares ETF is leading in TER. Up until 2021, this ETF was the most expensive in terms of TER and didn’t rank that well in terms of Tracking Difference. As of February 2021, the TER decreased from 0.6% to 0.2%. This change is expected to bring Tracking Difference on par with Vanguard.
SPDR MSCI ACWI IMI UCITS ETF
- State Street provides the option of investing in World’s small caps – the only provider to allow this under UCITS.
- It has an impressive 0.1% Tracking Difference given its reliance on risk model replication.
- But, there are a couple of potential problems with this ETF. First, you will be relying on a correct sampling by the manager, and less on a more mechanical replication like for the other ETFs listed above. In practice, this means the number of stocks is lower.
- It carries a 0.17% TER, that was lowered from 0.4% in Q1 2023.
Note that SPDR also has a MSCI ACWI ETF, not tracking small caps, but it is much smaller than rivals and has a worse TD.
What About Non-UCITS ETFs?
Some investors may want to invest in non-UCITS ETFs:
- US Investors
- Investors from Countries like Switzerland
- Non-Professional Europeans that may be treated as professionals
The iShares MSCI ACWI ETF and SPDR MSCI ACWI IMI ETF are the same as in UCITS Format, but with higher liquidity.
The best ETF is Vanguard Total World Stock ETF that tracks FTSE Global All Cap and also includes Small Caps. It has over 7,000 Stocks.
What About UK Mutual Funds?
In addition to ETFs, UK Investors have the possibility to invest in Index Mutual Funds. Two additional options are:
- Vanguard FTSE Global All Cap Index Fund (TER 0.23% and domiciled in the UK)
- HSBC FTSE All-World Index Fund – Class C (TER 0.13% and domiciled in the UK)
The first offers full diversification with over 7,000 Stocks and including Small Caps. Learn more about this Index.
From Bankeronwheels.com
Get Wise The Most Relevant Independent Weekly Insights For Individual Investors In Europe & the UK
Liked the quality of our guides? There is more. Every week we release new guides, tools and compile the best insights from all corners of the web related to investing, early retirement & lifestyle along with exclusive articles, and way more. Probably the best newsletter for Individual Investors in Europe and the UK. Try it. Feel free to unsubscribe at any time.
🎁 In the first email, you can download a FREE comprehensive 2-page checklist to construct & monitor your portfolio and clean up your personal finances.
Next Steps
Of course, life is more complex than this simple strategy. Our Personal Finances are, well, by definition personal. Most of us also want to ‘sin a little’ and overweight some markets, based on personal views or risk circumstances.
Also, some local laws may not give access to Global ETFs. For instance, French investors don’t have easy access to them in their PEA Tax Wrapper. But they can get around the issue by understanding how portfolio managers divide the World and replicate through a Developed and Emerging exposure.
Good Luck and Keep’em* Rolling!
(* Wheels & Dividends)


Broker Safety: Should You Rely On Broker Insurance?

Dodl By AJ Bell Review – AJ Bell’s Younger Brother


Vanguard LifeStrategy Review – A Retriever In A Babushka Doll


Why Do Portfolio Managers Care About Factors? It’s Not What You Think.


Money Market Funds: Are ETFs The Best Bang For Your Buck Or A Risky Ride?


4 Things I Learned In 4 Years Of Running A Finance Blog
HELP US
🙋 Wondering why finding honest Investing Guidance is so difficult? That’s because running an independent website like ours is very hard work. If You Found Value In Our Content And Wish To Support Our Mission To Help Others, Consider:
- 📞 setting up a coaching session
- ☕ Treating us to a coffee
- 🐶 Purchasing Our Official Merchandise
- ❤️ Exploring Other ways to support our growth, both financially and non-financially.
DISCLAIMER
All information found here, including any ideas, opinions, views, predictions expressed or implied herein, are for informational, entertainment or educational purposes only and do not constitute financial advice. Consider the appropriateness of the information having regard to your objectives, financial situation and needs, and seek professional advice where appropriate. Read our full terms and conditions.